Topology View
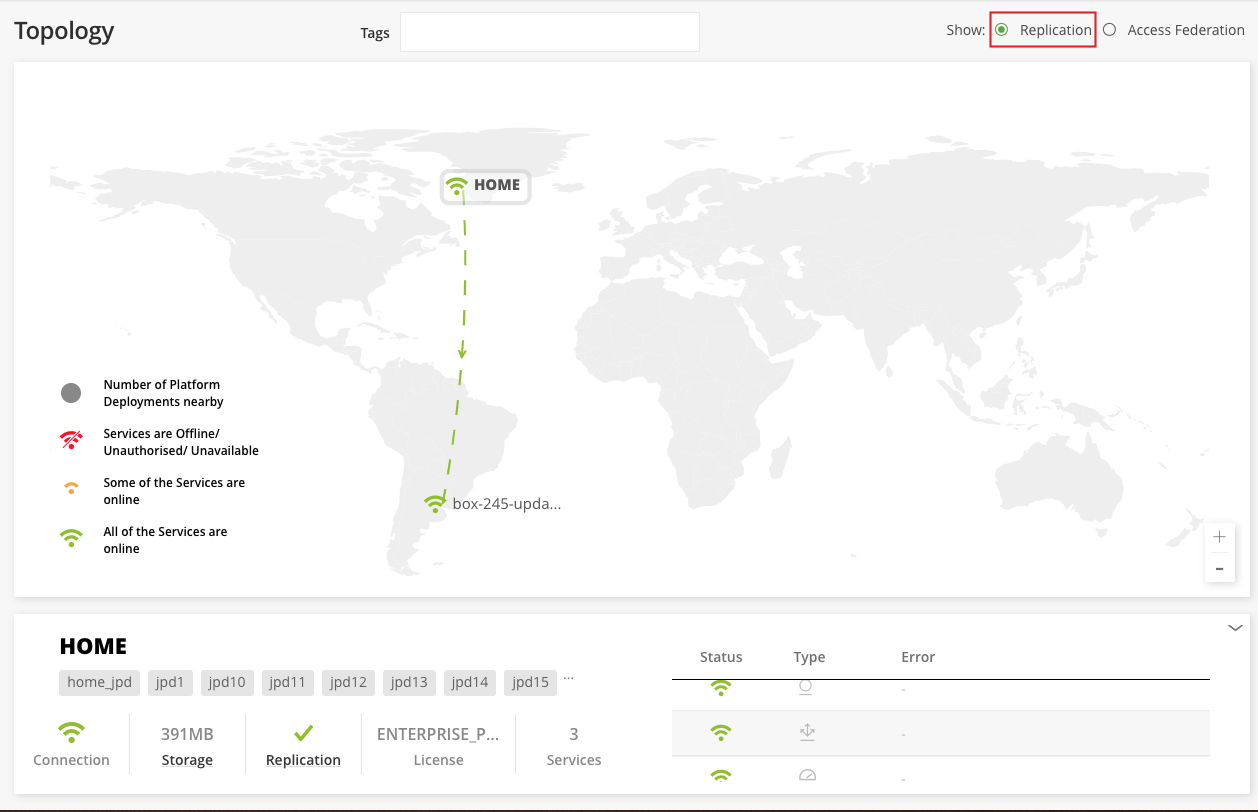
The Dashboard Topology view displays JPDs across geographical areas information and provides information about the status and health of your Replication or Access Federation.
Replication Status
Displays replication status with arrows indicating the direction of the replication process with a Health Replication Status indicator in the bottom tab.Replication is used in a variety of use cases to synchronise repositories between remote JPDs. Depending on repository size this may require the transportation of huge quantities of data. Since speed of transportation is limited by bandwidth and network latency, this is a process that may take hours and even days to complete.佛r more information, see Replication. TBD未知的用户(ranjithr)
Access Federation
Displays the status and health of the Access Federation with arrows indicating the JPD
Access Federation gives you control over access to all, or any subset of your services from one location by synchronising all security entities (users, groups, permissions and access tokens) between the federated services.
- Storage:Displays storage utilisation over a period of time for repositories and package types.
- 分配JFrog许可证:
- Service Breakdown Per JPD:
Trends View
TheTrendspage displays a set of graphs and data related to storage and usage based on historical data collected and stored in the Unified JFrog Platform.
- Xray Violations:Displays the detected security violations according the repositories and builds.
- Distribution:Displays the success and failure of distributed release bundles to Edge Nodes.
The JPD Dashboard displays the metrics according to their category. The dashboard presents data for the time range and filters set in three panes.
- Mini graph: Displayed on the bottom in the order of the release lifecycle. The value displayed on the graph is an aggregate of data based on the selected filters along with a historical trend.
- Main graph: Selecting a mini graph from the lower pane, displays the visualization of the data by build
- Right pane: Displays the details of a selected point in the main graph including the break down by builds and runs
Collection Frequency
The Dashboard mechanism collects the data used to generate the graphs every 3 seconds.


